

Registry data can tell you what a project claims - satellite data and geospatial analysis tells you what is actually happening on the ground.
Carbon projects can pass standard verification and carry a credible registry listing while leaving important questions unanswered: is a forest actually being protected, or is deforestation pressure simply moving next door? Is a Direct Air Capture (DAC) facility sitting on protected land? Are local communities being displaced to make way for a project that claims to benefit them?
CEEZER’s geospatial analysis provides an independent, continuous view of ground conditions: how land is used and changing, what is driving that change, whether nearby communities are affected, and whether a project's physical footprint matches its claims. For carbon buyers, this translates into fewer post-purchase surprises, stronger evidence if a credit's integrity is challenged, and confidence that a project sourced today will hold up over a multi-year delivery contract.
In this piece, we cover:
- What standard documentation and registry data does not cover
- How and why CEEZER builds an independent, satellite-backed view of each project it sources
- How the analysis goes beyond forest loss to cover community rights, water stress, and protected area compliance
- What this means for buyers, especially those building long-term portfolios
The key data carbon standards don’t deliver
Forest carbon projects - particularly those operating under REDD+ and similar avoided-deforestation frameworks - generate carbon credits by demonstrating they prevented forest loss that would have otherwise occurred. Technology-based projects, such as Direct Air Capture (DAC), do it by demonstrating permanent removal of CO₂ from the atmosphere. The logic is straightforward, but establishing it with confidence takes more than documentation alone.
Two key questions are worth asking of any forest carbon project, and both can affect the integrity of the resulting credit issuances.
Is the claimed benefit actually being delivered inside the project boundary?
Why we ask: Tree-cover loss can occur gradually, unevenly, and in ways that aggregate reporting may not immediately notice. For non-forest projects, infrastructure decisions, site location, and operational footprint can create equally hard-to-spot risks in project documentation. Independent spatial monitoring adds a layer of verification that runs in parallel with formal processes.
Did stopping deforestation within the project boundaries just push it somewhere else, instead of actually reducing it?
Why we ask: For forest projects, this is the question of project leakage, and it can be complicated to answer. Activity may increase in adjacent unprotected land even as the impact within the project boundary is genuine. For all project types, impact on surrounding communities, water systems, and protected areas may never appear in a verification report. Understanding whether those dynamics are at play requires looking beyond the project boundary itself.
Answering these questions precisely requires spatial analysis built on top of, and independent from, project documentation. This is what many standards don’t offer - and what CEEZER’s geospatial analysis delivers.
Closing the data gap: How CEEZER's geospatial intelligence bring transparency to nature-based solutions
CEEZER's framework is based on the most intuitive application of geospatial analysis in carbon markets: forest loss monitoring. It draws on six open datasets — annual tree-cover loss, drivers of deforestation, land cover classification, ecoregions, terrain slope, road density — layered and cross-referenced to build an evidence base that goes well beyond what any single data source provides.
A year-by-year map of forest loss spanning over two decades provides the robust foundation for CEEZER’s framework, which tracks trends over time, identifies peak tree loss years, and measures whether the rate of clearing within and surrounding a project boundary has genuinely changed since the project began. From here, we begin evaluating project impact and integrity.
Evaluating project integrity through forest loss data
Forest carbon projects are primarily designed to prevent or reverse significant tree loss within their boundaries, whether the loss is driven by natural (fire, drought, pests) or human-driven (logging, land conversion) stressors.
A common mistake is misattributing human-driven forest loss outside the project area as to natural causes. Getting this distinction right can be the difference between an accurate and an inflated impact claim, and understanding what is actually driving forest loss in the area gives a clearer, more honest picture of what the project is achieving.
In addition to forest loss data, CEEZER also relies on clearly defined reference zones to evaluate the impact of a forest carbon project. Here’s how it works.
Evaluating project impact through a credible reference zone
To measure a project's real impact, you need to know what deforestation would have looked like without it. CEEZER builds this baseline, called a counterfactual, using a carefully matched reference zone, not a generic regional average. The process has two stages.
Stage one: Define eligible land
Starting from the surrounding districts, CEEZER narrows the field to land that's genuinely comparable: same forest cover, same ecological zone, and exposed to similar economic and political pressures as the project area.
This stage also evaluates land by different types of tree-cover loss, which have different implications for project integrity. CEEZER’s analysis classifies why each eligible patch of land experienced tree-cover loss: permanent agriculture, commercial logging, wildfire, settlements and infrastructure, or natural disturbance.
Stage two: Find the best match
Each eligible patch is scored against the project on two factors: road density (the strongest predictor of clearing pressure, since access drives land-use change) and slope (flatter land clears more easily). The closest match on both becomes the reference zone.
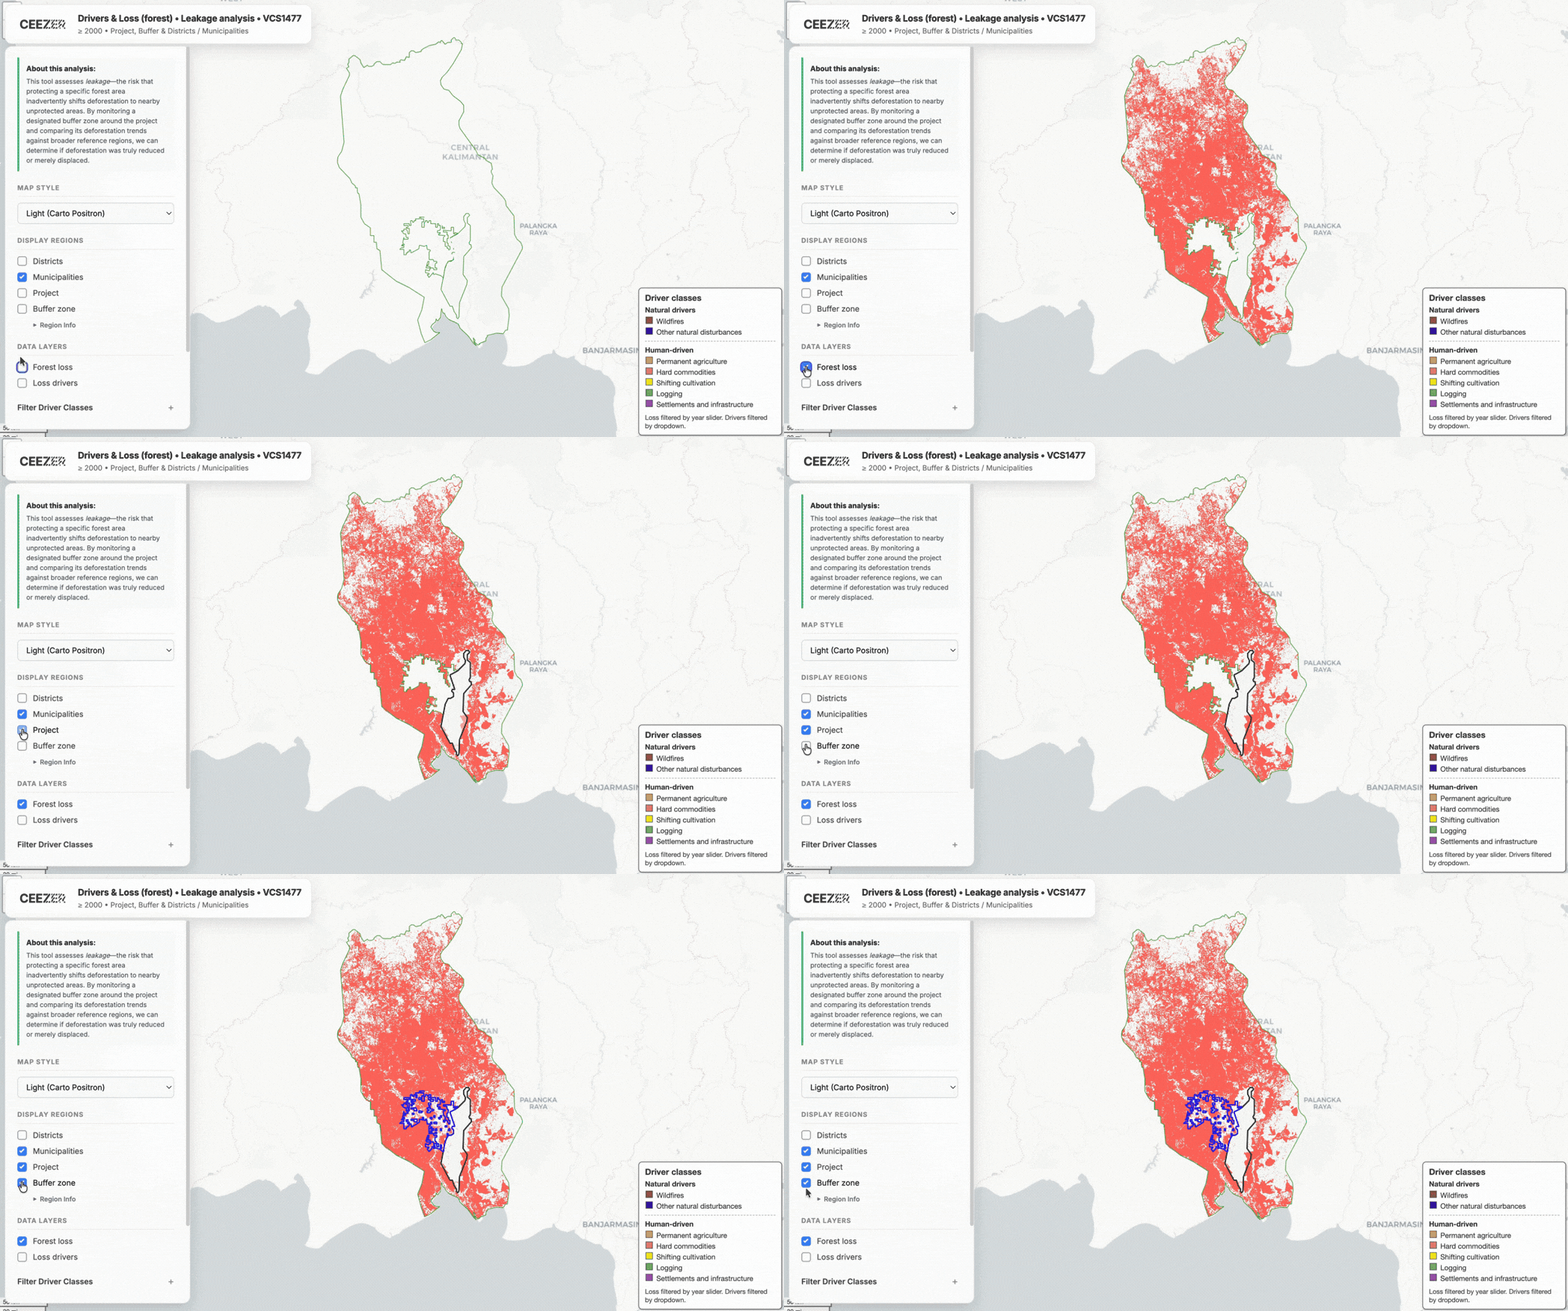
This final reference zone represents a "what would have happened anyway" baseline built on spatial evidence, not assumptions. With this zone in place, we can begin assessing the project for signs of leakage (relocated deforestation, instead of reduced).
Leveraging a reference zone to identify leakage signals
The analysis compares deforestation rates inside the established reference zone against three benchmarks: the surrounding district, the whole country, and the reference patch itself - both before and after the project began.
If tree loss in the reference zone speeds up faster than the national trend after the project starts, that's a signal worth investigating - though not definitive proof of leakage. Local factors like land tenure and agricultural activity could also explain it, but it's a pattern buyers should consider before making a purchase.
This is supplementary intelligence working alongside formal leakage accounting, not instead of it. It gives buyers an independent data point to assess the robustness of a project's claims. CEEZER backs these findings with interactive maps, ensuring spatial evidence can be verified directly.
Beyond forest loss: Further data and insights driven by geospatial analysis
Forest loss monitoring is the most familiar application of geospatial analysis - but it is not the only one.
Satellite and spatial data can identify a broad variety of carbon project-related risks which are equally invisible in project documentation - and equally consequential for buyers. Each of these checks addresses a different way a project can expose a buyer to reputational, legal, or financial risk that might not show up in a registry listing.
Community rights and indigenous land: CEEZER uses geospatial data to determine whether a project overlaps with indigenous or community land. If it does, that overlap is compared to project documentation to confirm free, prior, and informed consent (FPIC) was obtained. Where allegations of forced displacement exist, satellite imagery can show whether settlements have been partially or fully cleared over time.
Historical land use: If a project area was previously used by local communities for agriculture, grazing, or other purposes, and the project now restricts that access, spatial analysis allows CEEZER to identify this without relying on project developer disclosure alone.
Water stress: For projects establishing non-native vegetation or water-intensive industrial systems, CEEZER maps the project location against water scarcity data to assess whether the project creates risks for surrounding communities or ecosystems.
Protected area compliance: Geospatial layers allow CEEZER to verify whether a project site, or any associated infrastructure, overlaps with legally protected areas, biodiversity zones, or sensitive IUCN-classified land — even where that overlap is not disclosed in project documentation.
A project can look entirely clean on paper and still carry material risks that only become visible when you look at where it is located, what surrounds it, and what has changed over time.
CEEZER Prism: Turning geospatial data into project due diligence
Geospatial analysis is just one layer within CEEZER Prism - our proprietary risk intelligence engine, which powers every project CEEZER sources and monitors.
CEEZER's dedicated Risk Team uses Prism to evaluate projects across more than 400+ data points spanning quality risk, delivery risk, and host country risk. Geospatial analysis is an integral part of the quality risk assessment, helping assess risks related to non-additionality, over-crediting, reversal, leakage, and negative environmental and social impact.
Satellite data is also increasingly relevant for non-forest project types. In one example, our Risk Team flagged a Direct Air Capture (DAC) project with strong registry and verification credentials during CEEZER's independent spatial review. The geological storage site was located in an area of extreme water stress, and the site boundary overlapped with a RAMSAR-protected wetland and a UNESCO Man and Biosphere Reserve - neither of which was visible in public project documentation. CEEZER's proprietary tooling identified these factors before any commercial decision was made by the buyer.
This is the value of geospatial analysis and Prism in practice: a risk avoided before capital was committed, not discovered after. This is exactly the kind of early signal Prism is designed to provide.
Going beyond carbon standard requirements
Formal verification processes, including third-party verification body (VVB) assessments, play an essential role in the voluntary carbon market. They establish whether a project adheres to its stated methodology and meets registry standards. CEEZER's geospatial analysis is designed to complement that process, not replace it.
What geospatial analysis adds is an independent, continuous view of what's happening on the ground: how land is being used and changed, what's driving it, whether surrounding communities are being affected, and whether a project's physical footprint matches its claims.
For buyers, that translates into three concrete advantages: fewer surprises after purchase, a stronger evidence base if a credit's integrity is ever challenged, and confidence that a project sourced today will still hold up years into a multi-year delivery contract.
This matters most for buyers building long-term portfolios, particularly those committing to credits years ahead of delivery. Geospatial verification isn't a one-time check — it's one of the ways CEEZER ensures the projects it sources hold up not just at signing, but throughout the life of the portfolio.
Want to understand how CEEZER screens the projects in your portfolio? Talk to our team.
Sources:
Global Forest Change (v1.12): "Global Forest Change 2000–2024 Data Download (v1.12)" by Hansen/UMD/GLAD Team is licensed under CC BY 4.0.
10m Annual Land Use Land Cover (V2): "10m Annual Land Use Land Cover (9-class) V2" by Impact Observatory, Microsoft, and Esri is licensed under CC BY 4.0.
RESOLVE Ecoregions 2017 Map App: "RESOLVE Ecoregions 2017 Map Viewer" by RESOLVE Biodiversity and Wildlife Solutions is licensed under CC BY 4.0.
BioScience Research Paper (Ecoregions): "An Ecoregion-Based Approach to Protecting Half the Terrestrial Realm" by Dinerstein et al. is licensed under CC BY 4.0.
NASA SRTM Digital Elevation Model: "NASA Shuttle Radar Topography Mission Global 1 arc-second V003" courtesy of the NASA EOSDIS LP DAAC is free of copyright restrictions (U.S. Public Domain/CC0 fallback).
GLOBIO GRIP Roads Database: "GRIP Global Roads Database (GRIP4)" by GLOBIO / Meijer et al. is licensed under CC BY 4.0.







.png)